Regardless of whether one is producing low-cost vertical cavity surface emitting laser diodes (VCSELS) for consumer electronics or using a tunable mode-locked Ti:Sapphire laser for multi-photon fluorescence microscopy, having accurate spectral data during the manufacturing process is critical for ensuring quality, repeatable product. Unfortunately, the overwhelming number of laser engineers are still relying solely on large and costly optical spectrum analyzers (OSAs) for spectral testing. While these devices provide excellent spectral resolution and dynamic range, the size and cost often limit their ability to be deployed at multiple points throughout the manufacturing environment [1].
Additionally, the scanning nature of these devices results in extremely low sensitivity and therefore require long integration times, making OSAs a poor choice for high-speed automated production lines [1]. Alternatively, miniature spectrometers take advantage of a fixed grating spectrograph in combination with a linear detector array to enable the entire spectrum to be measured simultaneously at high speeds.
While this geometry does not allow for real-time adjustment of spectral range and resolution, it does result in much higher sensitivity when compared to the scanning geometry used in OSAs since it does not require a different acquisition at each measurement point. This speed advantage is not only helpful for fast-paced high-volume testing environments but also allows for more accurate measurements of pulsed laser systems through the use of high-speed triggering. As a result, some laser manufacturers are adopting miniature spectrometer technology as a complementary technology to the more traditional OSA.
This article will explore the benefits of miniature spectrometers for laser characterization in-line as well as in the lab, but first, it is essential to take a step back and briefly review the fundamentals of miniature spectrometers.

Fundamentals of Miniature Spectrometers
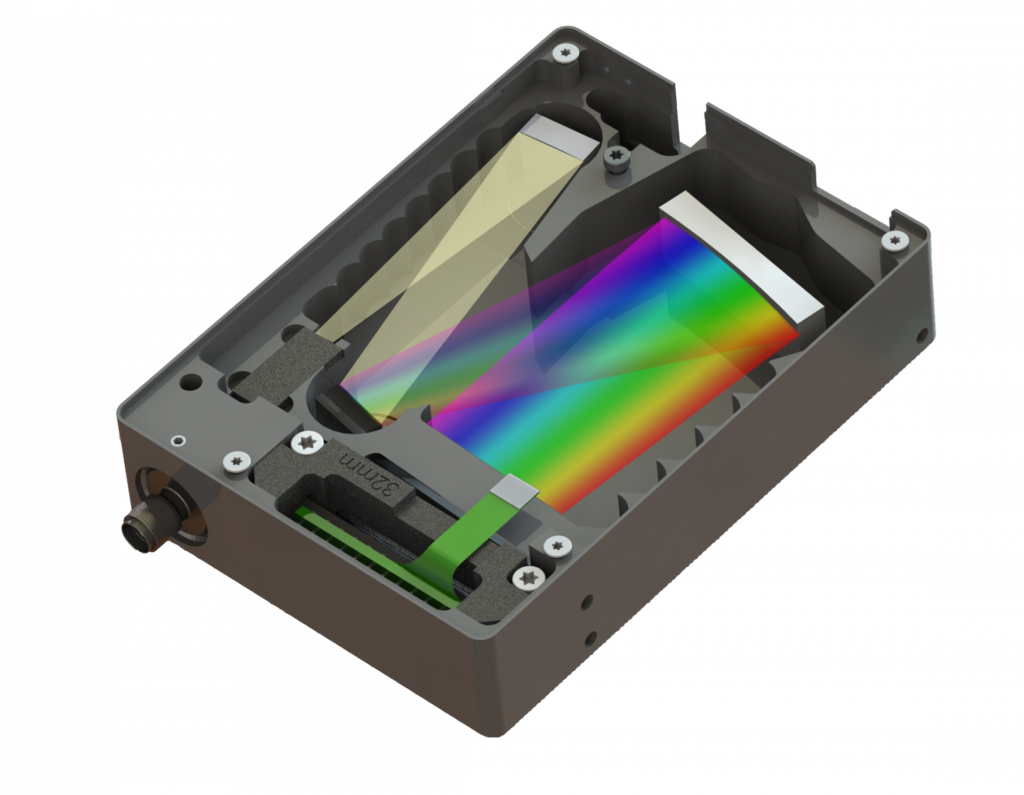
Like all spectrometers, Avantes’ miniature spectrometers are essentially an imaging system which separates the image of the entrance slit into a large number of spatially separated, monochromatic images in the detection plane. In the Czerny-Turner spectrograph design, this is accomplished by first collimating the light from the entrance slit using a concave mirror and directing it to a reflective dispersion grating. As a result, the different wavelengths of light reflect off of the grating at different angles, spatially separating more and more the further away from the grating they travel.
This plurality of collimated rays is then focused back down to form an image of the entrance slit at the detector plane by a larger truncated focusing mirror, but as a result of their angular separation, the image of each wavelength is now separated along the axis perpendicular to the orientation of the entrance slit. By placing a linear array in the image plane, each pixel can be calibrated to correspond to a unique wavelength. Figure 1 below shows a schematic diagram for a typical Czerny-Turner miniature spectrometer.
It is important to note that due to the off-axis nature of the Czerny-Turner optical design, at low f-numbers these systems tend to exhibit large amounts of coma† which can result in decreased spectral resolution and asymmetric peak distortions. For this reason, all of Avantes’ high-resolution miniature spectrometers for laser testing are designed with a large f-number since throughput is far less critical than resolution for laser measurement. It is must also be pointed out, however, the necessity of filling the entire numerical aperture of the collimating mirror when utilizing this particular spectrograph for laser testing.
This note may seem trivial but if a laser is aimed directly into the entrance slit it will not be appropriately collimated and as such will not strike the grating at the right angle and with the proper fill factor resulting in erroneous artifacts in the spectrum. This mistake will inevitably result in a single-mode laser appearing to have multiple spectral modes; therefore, it is always recommended that the laser light is coupled into the spectrometer via a fiber optic cable in order to ensure the accuracy of the spectral measurement.
† Coma is an off-axis optical aberration that causes the image to blur out and have a tail, resembling a comet or an ice cream cone. This degradation of image quality is inversely proportional to the f-number of the optical system resulting in a trade-off between optical throughput and image quality.
Laser Testing Configuration
When configuring a miniature spectrometer, three main components, the entrance slit, dispersion grating, and detector array, must be specified up front as these work together to determine the spectral range, resolution, and sensitivity of the instrument.
For laser characterization where there is an overabundance of spectral energy density, it is always preferable to configure these options to provide the highest resolution and dynamic range, since sensitivity and spectral range are of far less importance. This is typically accomplished by utilizing a CMOS detector array with the smallest pixel pitch available, a high groove density grating, and the smallest slit size possible. It is evident from the spectrograph geometry that this choice of slit width, pixel size, and grove density will all lead to the narrowest possible resolution, but less obvious why a CMOS array would be preferable to a CCD array.
CMOS detectors, when compared to CCD detectors, typically exhibit larger dynamic ranges and more linear responsivity, which is extremely important for detecting small changes in large signals. To demonstrate this effect, an 830 nm laser from Innovative Photonic Solutions model number I0830MB0600M-HP was tested using an AvaSpec-ULS4096CL-EVO with a 5 mm entrance slit and a 1200 groove/mm grating. The spectrometer was coupled via an SMA905 fiber patch cord to a cosine corrector and irradiance calibrated, to convert the output from arbitrary counts per nanometer to spectral irradiance, as shown in figure 2A.
It is important to note that the output of this laser was coupled to a 0.22NA 105mm fiber optical cable and terminated at an SMA905 bulkhead resulting in a homogenized divergent output beam. The cosine corrector was secured at a fixed distance in front of the diverging beam uniformly illuminating it, as the drive current was adjusted via the lasers USB interface.
This configuration was used to prevent the spectrometer from saturating during the test, but as a result, the total laser power was not able to be calculated. Instead, the power incident on the active area of the cosine corrector was measured and displayed in figure 2C, by numerically integrating the spectra and then multiplying the result by the active area of the cosine corrector. The data shown in figure 2 demonstrating the extremely high linearity of the CMOS detector with an R2 > 0.99, for both the peak spectral irradiance and the integrated laser power. To measure the total output power from such a high-power laser, an integrating sphere must be used instead of a cosine corrector.

from 250 mA to 550 mA, (B) linear regression model
based on peak spectral irradiance, and (C) linear regression
model for integrated laser power each of which produces
an R2 > 0.99
Laser Characterization Application Examples
With a firm understanding of the basic requirements for laser testing with miniature spectrometers, it is now time to explore a few typical examples where they are preferable to OSAs. The following section evaluates how Avantes’ spectrometers are used in two different applications: VCSEL manufacturing and tunable laser monitoring. While this list is far from all-encompassing, it provides a good overview of the advantages of utilizing the technology.
Avantes Spectrometers in VCSEL Manufacturing and Testing
Unlike edge emitting laser diodes, which cannot be tested until the die are cut from the wafer, VCSELs can be tested at various stages of production, including whole wafer testing because the laser light is emitted perpendicular to the pn-junction [2]. This allows for thousands of VCSELs to be simultaneously tested on a single wafer, leading to higher production efficiency and reduced scrap rates. As a result, high-speed spectral measurement on the production line is required to take advantage of the unique wafer level testing ability afforded to VCSELs. Manufacturers of these devices and device integrators require optical spectrometers featuring high resolution, high speed triggering response, and short integration time all of which can easily be provided by Avantes’ miniature spectrometers.
Figure 3 shows three different examples of VCSEL spectra collected during wafer processing. Figures 3A is an example of a single-mode VSCEL which is properly manufactured showing only a single peak, while figure 3B shows a defective single mode VSCEL with an unwanted sidemode. By incorporating high-speed spectrometers into the wafer inspection process, VCSEL manufacturers can now utilize high speed binning and sorting technology similar to that used in the LED manufacturing process to significantly reduce costs.

showing a properly functioning single mode
laser output (A) and a malfunctioning
laser with a large side mode (B)
Avantes Spectrometers in Tunable Laser Monitoring
Many common laboratory laser systems can all have tunable outputs including mode-locked Ti:Sapphire lasers, external cavity lasers (ECLs), and optical parametric oscillators (OPOs). When dealing with these tunable wavelength laser sources, it is most common that monitoring output does not require the precision of an OSA. This is especially true in the case of picosecond to femtosecond pulse width lasers††, where the spectral bandwidth can often range between 0.5 nm and 20 nm. For example figure 4 below shows the spectrum of a 221 fs pulse width tunable Ti:Sapphire laser system at 800 nm, which has a tuning range of approximately 170 nm [3].
For this reason, the role of miniature spectrometers for laser testing is not limited to the production environment. Low-cost miniature spectrometers such as the AvaSpec-Mini 4096CL (as shown in figure 5), which can be configured with spectral resolution as fine as 0.5 nm, are ideal for monitoring the tuning of these ultra-fast lasers in the laboratory. For more demanding applications such as monitoring ECLs, another tunable narrow linewidth laser source, the AvaSpec-ULS4096CL-EVO, with resolution less than 0.1 nm, is an excellent alternative to OSAs.
Avantes instruments are used to support many pulsed laser applications in addition to tunable laser monitoring because of their outstanding timing control electronics. To profile a pulsed laser in a repeatable manner, the spectrometer used must allow for external triggering and near real-time response after receiving a trigger. Avantes instruments use an on-board field programmable gate array (FPGA) to control the timing performance, enabling high-speed, low-jitter timing controls with programmable external trigger delays as fast as 870 ns with jitter of 21 ns.
†† As a point of clarification it should be noted that in the case of ultra-fast laser measurement the spectrometer is not measuring a single pulse, but instead it is integrating over a large number of pluses measuring the average spectral bandwidth over the measurement period.

width Ti:Sapphire tunable laser [3]
Conclusion
As demonstrated above, many customers have found Avantes instruments to be a more than acceptable substitute for larger and costlier OSAs for a majority of their laser testing needs. The AvaSpec-ULS4096CL-EVO and the AvaSpec-Mini4096CL are the two most commonly used for laser characterization by a wide variety of laser manufacturers and integrators as part of their in-line quality control procedures. These miniature spectrometers are used to measure a variety of typical laser parameters including spectral peak wavelength, centroid, side mode suppression ratio, Full Width Half Maximum (FWHM), and RMS spectral bandwidth. These parameters can be directly measured using the AvaSoft software interface, or users can utilize Avantes’ easy to implement DLL library which makes integration with production software straightforward.
The high-resolution, high-sensitivity, easy software integration and high-speed acquisition characteristics of the AvaSpec line of spectrometers make them an affordable alternative to OSAs for a large subset of laser testing and characterization. By utilizing fiber coupled optical sampling accessories such as cosine correctors and integrating spheres Avantes’ spectrometers can characterize all types of lasers regardless of beam divergence and output power. To discover why so many laser scientists and engineers are turning to Avantes for equipment they can trust, contact your dedicated application support specialists today.
Related Products
Related Pages
Resources
[1] V. Coffey, “Optical Spectrum Analyzers: Understanding the latest features in optical spectrum analyzers,” Laser Focus World, June 2010.
[2] K. Iga, “Surface-Emitting Laser—Its Birth and Generation of New Optoelectronics Field” IEEE Journal n Selected Topics in Quantum Electronics, Vol. 6, No. 6, November/December 2000.
[3] P.G. Antal and R. Szipocs, “Tunable, low-repetition-rate, cost-efficient femtosecond Ti:sapphire laser for nonlinear microscopy,” Appl Phys B (2012) 107:17–22